![]()
The reality of a LEM, however, is more complex. Small scale renewable generation assets usually can’t compete with power stations in terms of wholesale price, and additional network charges and levies may make the price of local renewable energy too high for consumers to bear. Renewable energy generated and consumed in the same local area is arguably deserving of reliefs on these charges and levies, due to its reduced impact on the environment and network infrastructure. This would reduce a consumer’s bill, allowing more to be paid to local generators producing green energy, improving the business case for small scale renewable generation and storage. Governments and regulators can demonstrate their commitment to renewable energy by making that change.
But not all methods of ‘local energy matching’ can deliver promised benefits to network infrastructure. In much of the world, energy is traded based on fifteen to thirty-minute settlement periods. To balance distribution networks, however, local trading settlement periods must be much shorter. While a producer may generate the same total energy in a half hour period as their neighbour consumes, it’s unlikely this energy will be produced or consumed at a constant rate. Renewable output changes rapidly with the weather, and consumption can change literally at the flick of a switch. In the worst case, energy is generated in the first fifteen minutes of a half hour period but consumed in the second. While this is a match in terms of half hour energy volumes, it represents no benefit to network infrastructure; energy rushes out of the local network area and into the transmission network, then rushes back in. Worse, flexible assets dispatched to match half hour energy totals might make network balancing more challenging. This represents a significant problem for LEMs operating on a traditional half hour basis.
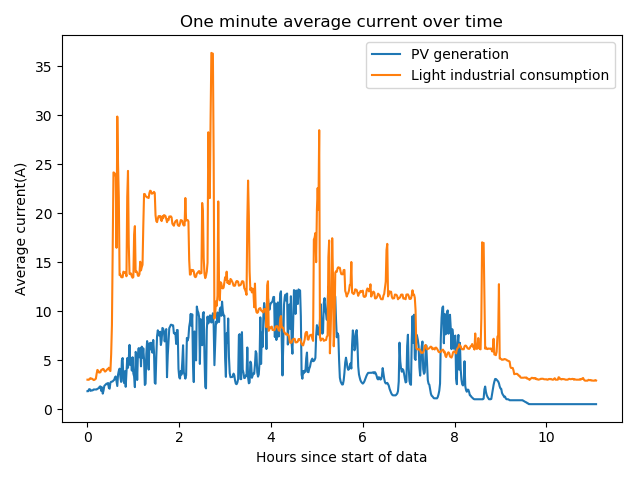
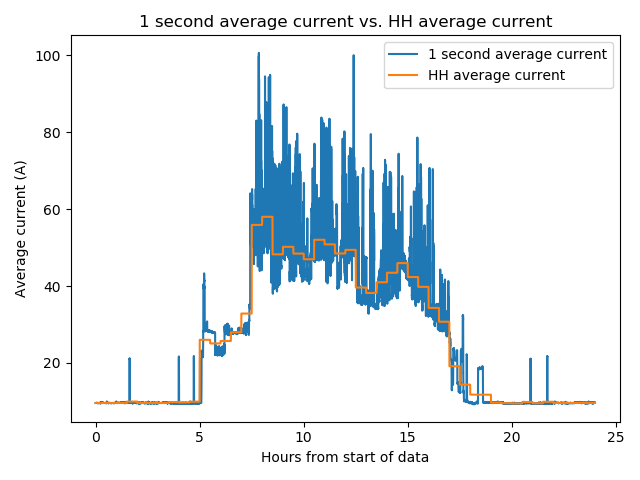
The graphs below show current measurements for a solar array and a consumer over the course of 12 hours, averaged at one second (a good proxy for instantaneous power), one minute and half hour intervals.
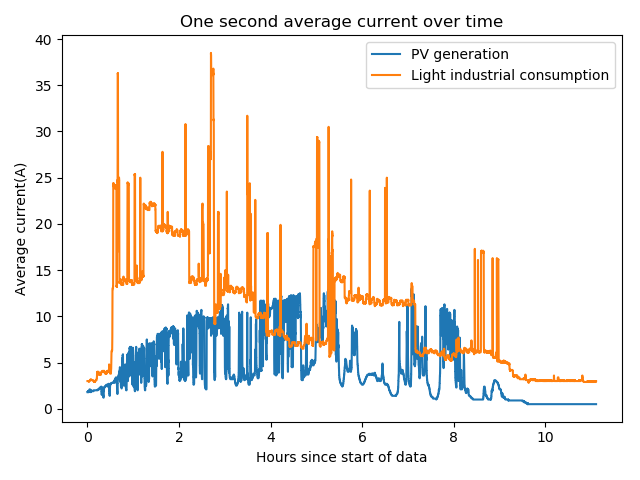
The ‘true’ matched energy, i.e. the amount of time for which a producer and consumer are matched in terms of power, is the area in common below both lines on a graph of instantaneous power; any area between the lines on the above graphs is therefore not really ‘matched’. At around eight hours, we can see that, as the averaging periods increase, the blue line moves from above to below the orange line. If we took an average of the whole twelve hours, we would have two straight lines, with the blue line completely underneath the orange one. Unless the two lines of instantaneous power never cross, the longer the period over which total energy is calculated, the more the matched energy will be overestimated.
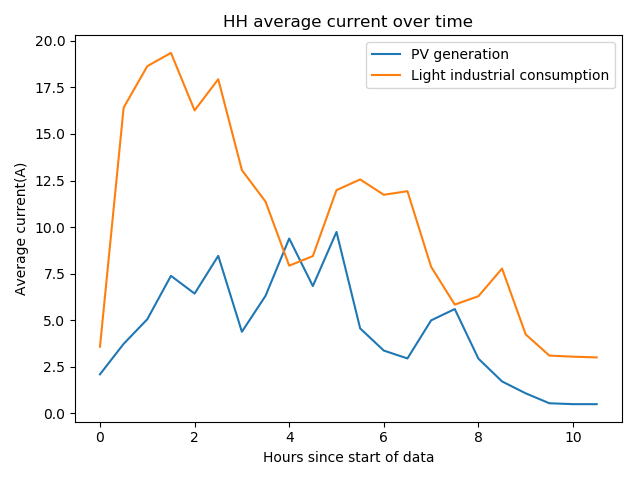
The next graphs show how the one second average consumption power of a light industrial consumer compares first to the one minute average and then the half hour average.
The one-minute average is usually closer to the ‘true’ power than the half hour average. Therefore, a flexible asset dispatched to match the one-minute average will be much closer to matching real power for much more of the time.
It might be thought that variations within the half hour will be cancelled out by opposite errors, given many LEM participants. On the graph below, however, we can see a large jump in consumption, during the period 7-7.30am.
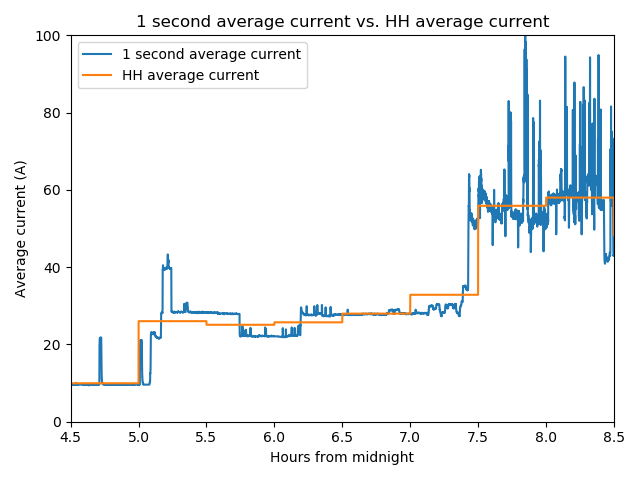
This jump isn’t a random error that will be cancelled out. Timed processes such as heating, industrial shift patterns, etc. mean it’s likely that similar jumps will be happening for other consumers at the same time.
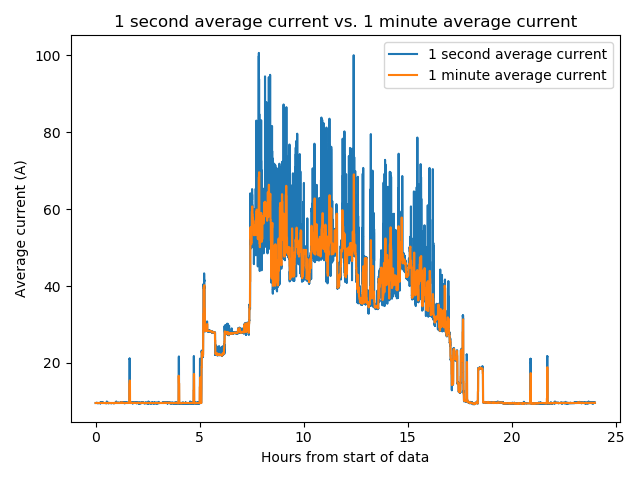
Due to changes in light levels and weather conditions, renewable generators in a local area are also likely to change their output at similar rates at similar times. The graph below shows the one second and half hour average output of a solar array over a day.
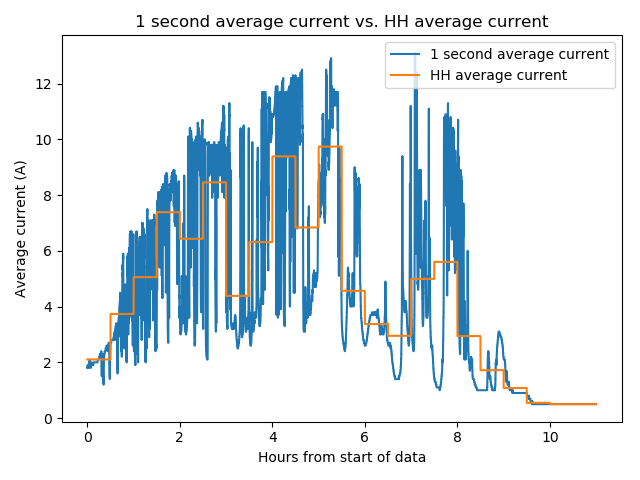
The output from 8-8.5 hours is about 3 amps on average, but the spread is around 10 amps, with a clear downwards trend that will likely be shared by all local PV generators. A consumer that tried to use or store the output of this array based on half hour total energy by consuming a constant 3 amps would absorb only a small proportion of its output at first, and would actually be taking energy from the grid by the end of the half hour.
By contrast, as shown in the next graph, minute-by-minute matching allows a flexible asset to track the trend across the half hour.
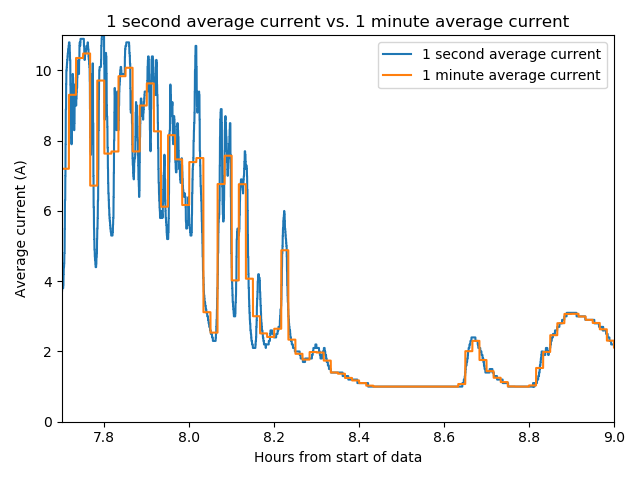
The spread across a given minute is much smaller, so a flexible asset can match the PV array’s output much more closely minute by minute. Moreover, any large variations within a minute, are more likely to be caused by very localised weather phenomena, such as small clouds, which won’t affect every PV generator in a local area simultaneously (similarly for wind turbines and gusts of wind).
To match production with demand on a minute by minute basis, we developed a Real Time Trading Platform (RTTP), a proprietary Swanbarton® product which arranges minute by minute energy trades. The system, already trialled on the island of Iona in Scotland, and soon to be deployed in a first-of-kind microgrid energy trading pilot in Rwanda, has proven that it can reduce both the magnitude and duration of peak distribution network power flows. Most curtailment events in constraint managed zones occur within three minutes of critical power thresholds being exceeded – too soon for most traditional balancing services to respond. By providing a price signal for dispatching flexible assets within a minute, RTTP can reduce the need for curtailment of precious renewable energy, impacts on productivity, and strain on network infrastructure. The result is less money spent on network reinforcement and the savings can be passed on to consumers and renewable energy generators.
Anthony Price is Managing Director of Swanbarton Limited, Dr. David Mutch works there as Software Engineer.